The first quarter of the year presented a bumpy start to 2022. We are in a time where multiple events seem to be occurring all at once. This includes inflationary concerns, Russia’s recent aggressive actions, and the Fed raising rates to name a few. Recently there has also been news regarding the inversion of the yield curve, and what that has signaled in the past. The headlines on the yield curve are important to watch, but it is also important to put this into perspective.
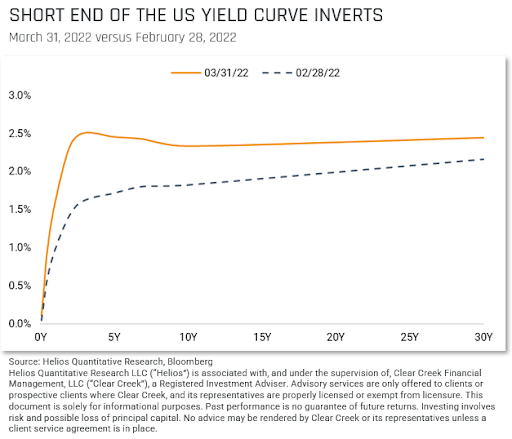
First off, the yield curve is a graph plotting what a specific type of fixed income (e.g., US Treasuries) is yielding (horizontal axis), versus their maturity (vertical axis). Typically, this graph will have an upward sloping curve, with longer term fixed income having a higher yield than shorter term fixed income. What has happened recently is a shorter part of the yield curve has risen above its longer-term counterpart. In the chart below you can see the upward sloping curve in the dotted line representing a normal curve, and then an inverted yield curve in the yellow line.
Traditionally this is seen as an indicator of future recessions but again, perspective is very important. As seen in the table below, over the past 44 years it has taken about one and a half years for a recession to start after a yield curve inversion (important to keep in mind the 2020 recession occurred due to the pandemic).

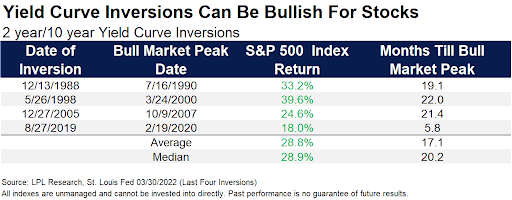
The next table reflects how the broad market (S&P 500) performed after the inversion of the 2 year and 10 year US Treasury, and also the number of months it took from the inversion date to the market’s highest point in that cycle. As you can see from the data, the market on average continues to march higher.
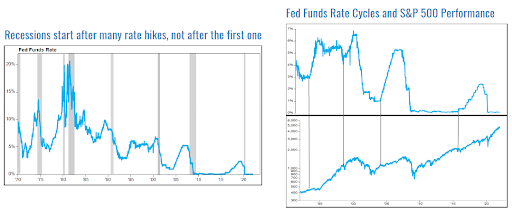
Inflation has been a consistent topic for over a year now, and rightly so as we have not seen readings at these levels since the early 1980s. The Federal Reserve recently raised short-term borrowing rates by 0.25% and is expected to increase that by another 0.5% at their next meeting. These rate hikes effect fixed income and the yield curve (pushing up the shorter end of the curve), but historically have not immediately triggered a recession. The chart below titled “Fed Funds Rate Cycles and S&P Performance” illustrates past rate hike cycles in the top chart, and the S&P 500 performance in the bottom. The vertical lines that connect the two reflect when a rate hike began and provide a graphical reference for how the S&P 500 performed thereafter. This roughly ties into the table above for how the S&P 500 performed after an inversion and shows the Fed’s activity during those periods.
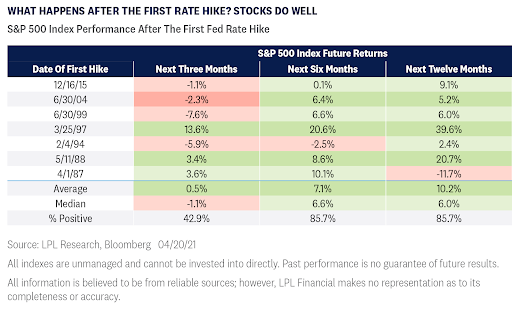
In looking at the chart titled “Recessions start after many rate hikes, not after the first one”, we could not better describe what history has shown. The grey shaded regions in this chart represent past recessions, and the blue line is the Fed Funds Rate. This reflects that we have not entered a recession when the Fed starts raising rates, but after a period of rate increases. Some pundits are speculating the implications of the Fed’s attempt to cool the economy while working to bring down inflation. Again, it is true that we have not seen inflation at these levels in some time but in looking back to the 1970s and early 1980s, we were in a higher inflationary environment then. Even during periods of higher inflation that we saw 40 to 50 years ago, there were many rate hikes before a downturn in the economy. Also, as shown in table below the market on average continues to perform well after the first rate hike in a cycle.
Lastly the chart below provides yet another way to view the yield curve (blue line) and past recessions (shaded grey areas). As mentioned above, only a portion of the yield curve is currently inverted. This lookback over the past 50 years reflects the percentage (vertical axis) of the yield curve that was inverted, essentially showing how much of it was at a rate higher than long-term rates. As you can see below, before most recessions a higher percentage of the yield curve was inverted (over 70% except for 2020). While the percentage of the yield curve that is inverted has ticked up recently, it is still below most of these historical levels.
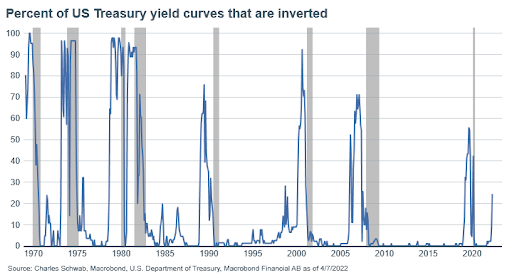
In looking back at similar times in the past, history has shown us that typically this initial inversion of a portion of the yield curve does not necessarily translate to a recession. With a volatile first quarter behind us, the upcoming earnings season will be important to see how inflation has affected companies and consumers alike.
Disclosures:
The opinions voiced in this material are for general information only and are not intended to provide specific advice or recommendations for any individual. All performance referenced is historical and is no guarantee of future results. All indices are unmanaged and may not be invested into directly.
Government Bonds and Treasury Bills are guaranteed by the US Government as to the timely payment of principal and interest and, if held to maturity, offer a fixed rate of return and fixed principal value


