June 2022 Market Update
BLOGS|16 Jun 2022
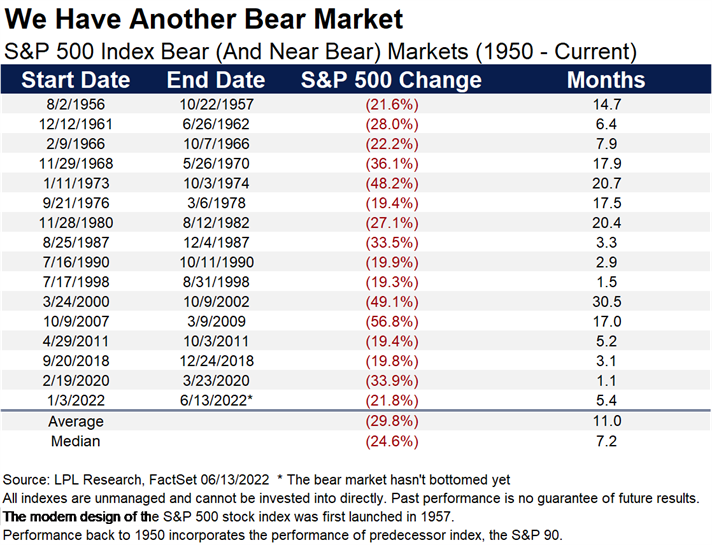
A bear market is officially here thanks largely to stubbornly high inflation. For […]


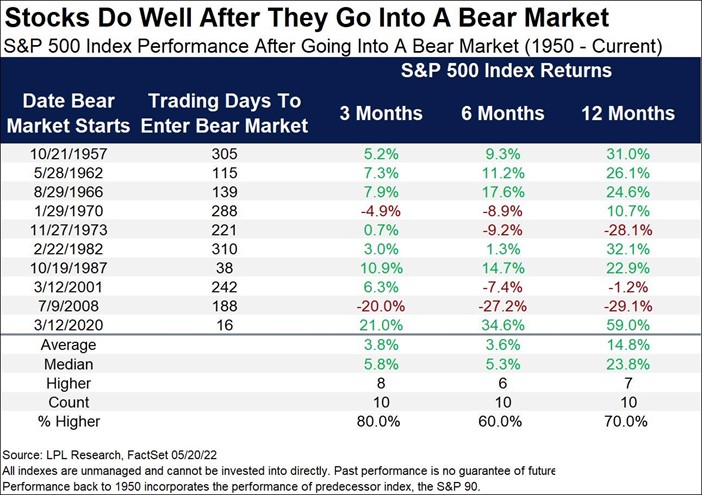
In closing, don’t forget that lower stock prices can lead to attractive valuations, improving prospects for future returns. It’s tempting to sell, but history tells us that after big declines it can be the wrong move.
This material is for general information only and is not intended to provide specific advice or recommendations for any individual. There is no assurance that the views or strategies discussed are suitable for all investors or will yield positive outcomes. Investing involves risks including possible loss of principal. Any economic forecasts set forth may not develop as predicted and are subject to change.
References to markets, asset classes, and sectors are generally regarding the corresponding market index. Indexes are unmanaged statistical composites and cannot be invested into directly. Index performance is not indicative of the performance of any investment and do not reflect fees, expenses, or sales charges. All performance referenced is historical and is no guarantee of future results.
All data is provided as of June 14, 2022.
All index data from FactSet.
The Standard & Poor’s 500 Index (S&P500) is a capitalization-weighted index of 500 stocks designed to measure performance of the broad domestic economy through changes in the aggregate market value of 500 stocks representing all major industries.
Personal consumption expenditures (PCE) is a measure of price changes in consumer goods and services released monthly by the Bureau of Economic Analysis (BEA). Personal consumption expenditures consist of the actual and imputed expenditures of households; the measure includes data pertaining to durables, nondurables, and services. It is essentially a measure of goods and services targeted toward individuals and consumed by individuals.
The VIX is a measure of the volatility implied in the prices of options contracts for the S&P 500. It is a market-based estimate of future volatility. When sentiment reaches one extreme or the other, the market typically reverses course. While this is not necessarily predictive it does measure the current degree of fear present in the stock market.
This Research material was prepared by LPL Financial, LLC. All information is believed to be from reliable sources; however LPL Financial makes no representation as to its completeness or accuracy.
Please remember to contact BentOak Capital (“BentOak”), in writing, if there are any changes in your personal/financial situation or investment objectives for the purpose of reviewing/evaluating/revising our previous recommendations and/or services, or if you want to impose, add, to modify any reasonable restrictions to our investment advisory services, or if you wish to direct that BentOak to effect any specific transactions for your account. A copy of our current written disclosure Brochure discussing our advisory services and fees continues to remain available upon request or at www.bentoakcapital.com. This information is not intended to be a substitute for specific individualized tax advice. We suggest that you discuss your specific tax issues with a qualified tax advisor. The opinions voiced in this material are for general information only and are not intended to provide specific advice or recommendations for any individual. All performance referenced is historical and is no guarantee of future results. All indices are unmanaged and may not be invested into directly. Securities offered through LPL Financial, Member: FINRA/SIPC. Investment advice offered through BentOak Capital, a registered investment advisor and separate entity from LPL Financial.