Stocks have gotten off to a very rocky start in 2022, with the potential for Federal Reserve rate hikes coming and the geopolitical worries over Russia and Ukraine only adding to the uncertainty. We don’t want to minimize the impact of that major geopolitical event, but there is some positive news out there, even though it might not feel like it.
With anxiety running high, here are 5 important numbers that should help calm some nerves and keep things in perspective.
- Starting with Russia and Ukraine, the truth is the U.S. economy and the overall stock market likely won’t be impacted much over the long-term by the recent conflict. In fact, stocks took most previous major geopolitical events in stride. Looking at more than 20 geopolitical events such as the attack on Pearl Harbor and 9/11, the S&P 500 Index fell only about 5% on average.
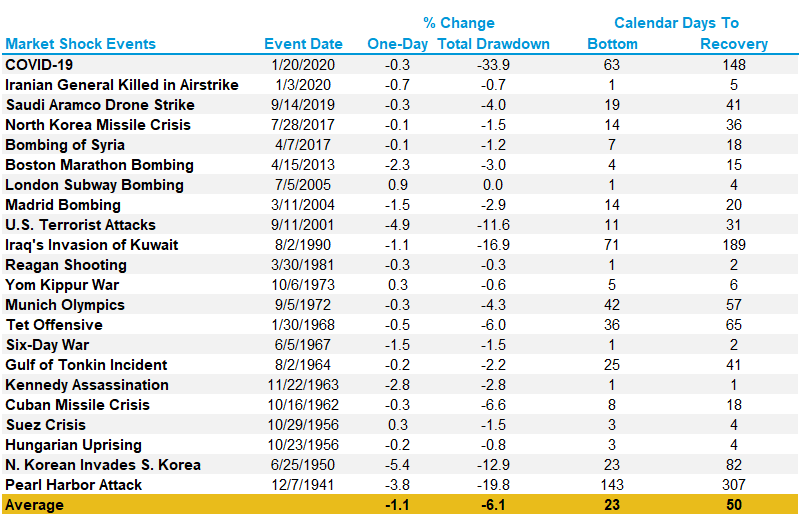
Source: LPL Research, S&P Dow Jones Indices, CFRA 10/31/21
All indexes are unmanaged and cannot be invested in directly.
Past performance is no guarantee of future results.
The modern design of the S&P 500 Index was first launched in 1957. Performance before then incorporates the performance of its predecessor index, the S&P 90.
2. The S&P 500 Index officially moved into a correction of 10% this week for the first time since March 2020. Since 1950, there has been an average of one 10% correction per year, so some volatility was likely simply due.
Number of 10% corrections in the S&P 500 Index by year:
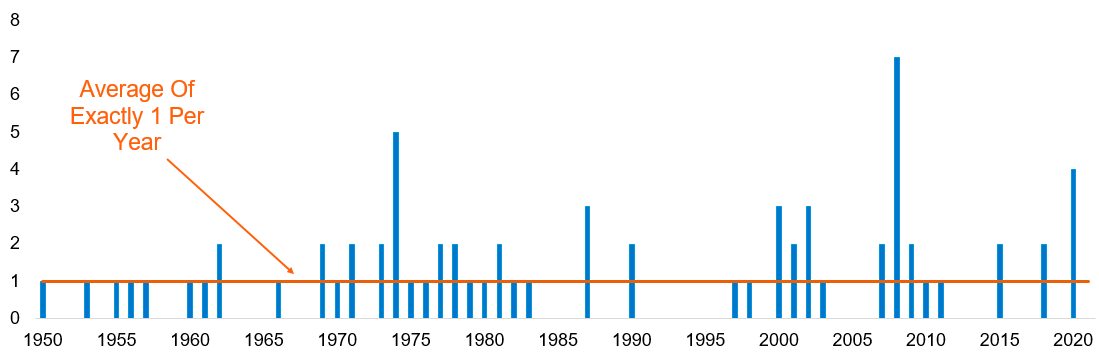
Source: LPL Research, S&P Dow Jones Indices, CFRA 10/31/21
All indexes are unmanaged and cannot be invested in directly.
Past performance is no guarantee of future results.
The modern design of the S&P 500 Index was first launched in 1957. Performance before then incorporates the performance of its predecessor index, the S&P 90.
3. On average, the index sees a peak-to-trough correction of 14% in any given year, and even in up years there is an 11% correction on average.
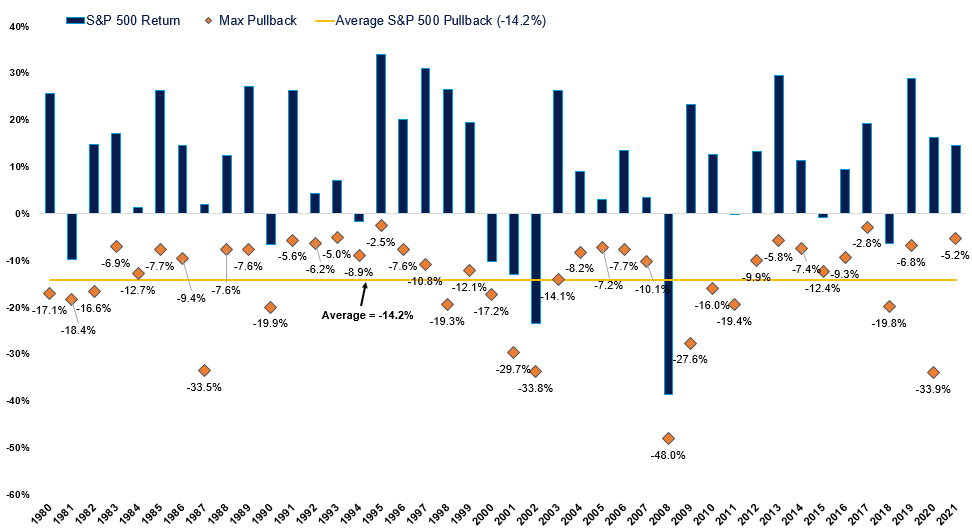
Source: LPL Research, FactSet 10/05/21
All indexes are unmanaged and cannot be invested in directly. Past performance is no guarantee of future results.
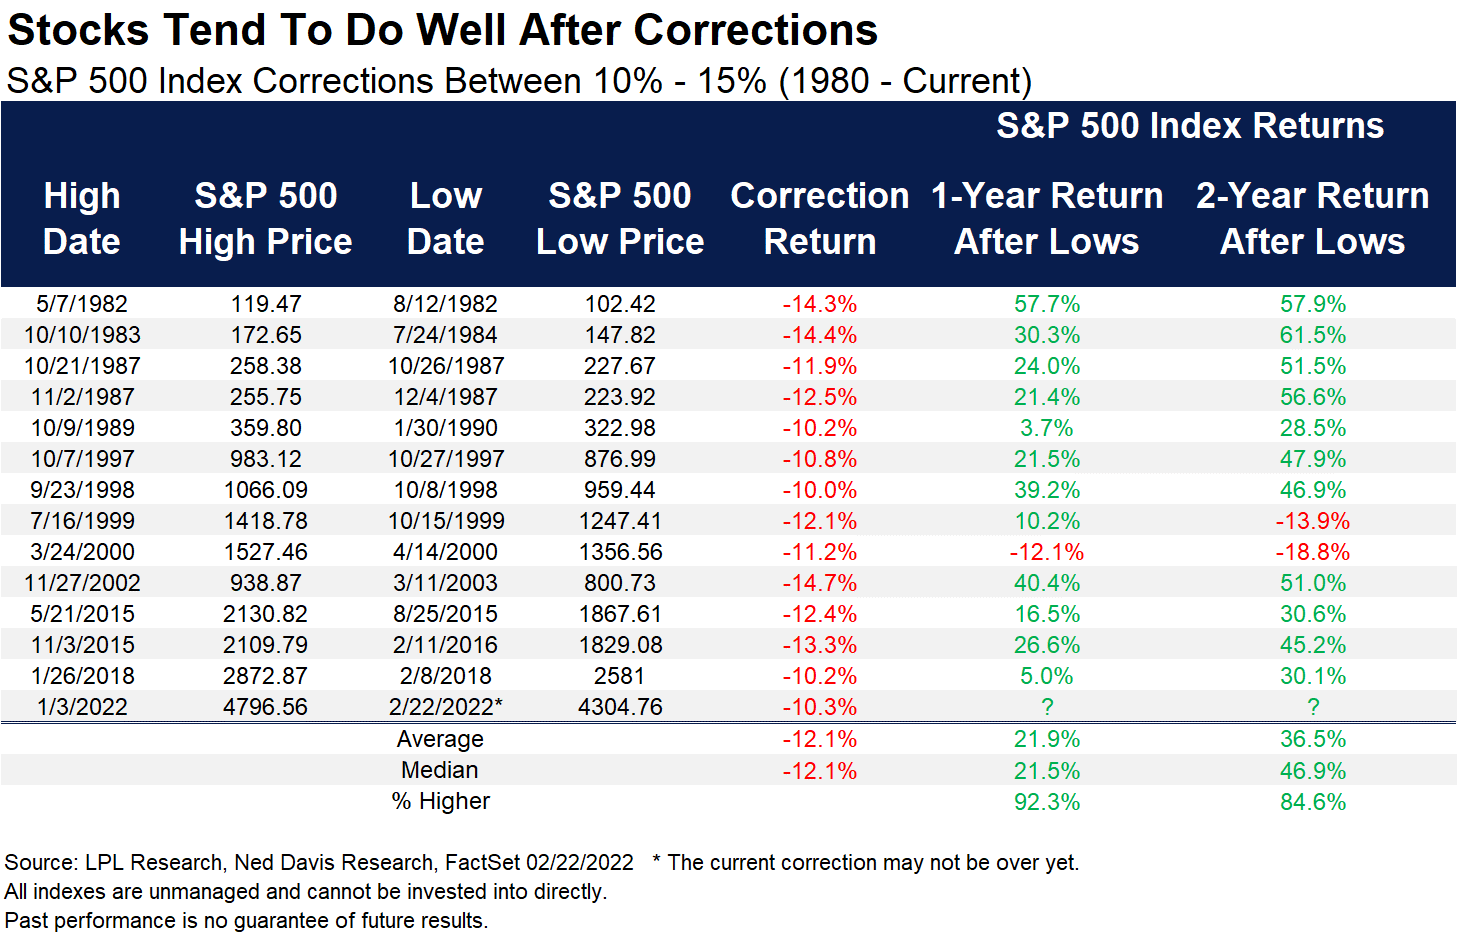
4. After a correction of 10-15%, the index has seen an average one-year gain off the lows of 22% and has gained in 12 of the 13 one-year periods.
5. Midterm election years tend to be among the most volatile out of the four-year presidential cycle. In fact, the average midterm year sees a peak-to-trough pullback of 17.1%, but stocks are up more than 30% off the lows on average a year later. Big annual declines are rare in mid-term election years though intra-year volatility is common.
Annual S&P 500 Gains/Losses Excluding Dividends Since 1960
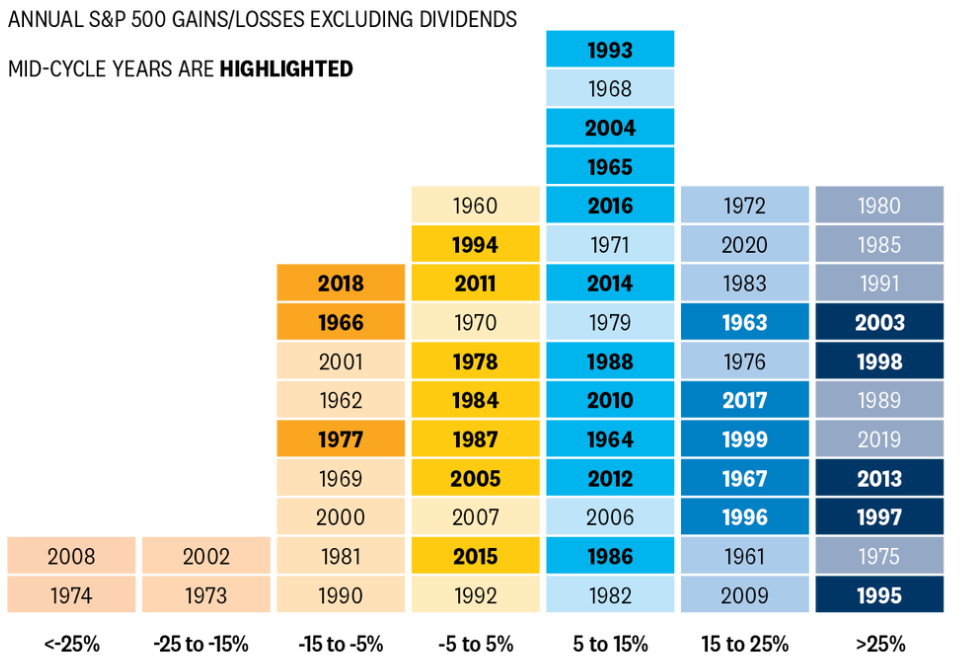
Source: LPL Research, FactSet 10/31/21
All indexes are unmanaged and cannot be invested in directly. Past performance is no guarantee of future results.
The good news is corporate America continues to see strong earnings. S&P 500 earnings per share in the fourth quarter are tracking to a 31% year-over-year increase (FactSet), roughly 10 percentage points above the consensus estimate when earnings season began. The top-line growth was extremely strong as well, with revenue growth up close to 15%. Lastly, profit margins saw very little compression, as companies with pricing power have been able to pass along higher costs and largely preserve those high margins, which are well above pre-pandemic levels.
Finally, COVID-19 trends are very positive as well, with new cases down more than 90% from the January peak (John Hopkins University). Many states are lifting mask mandates and a strong reopening will likely take place over the coming months and into the summer. Backlogs and bottlenecks continue to slowly trend the right way, and the labor force remains quite healthy as well.
The concerns and uncertainties are real, and the road ahead could be filled with more bumps and bruises. However, with U.S. consumers and businesses in solid shape, we think the U.S. economy could grow as much as 4% this year, much better than the pace of the last recovery.
They say it is always darkest before the dawn, and long-term investors should keep this in mind as better times are likely coming in 2022.
IMPORTANT DISCLOSURE INFORMATION: Past performance may not be indicative of future results. Different types of investments involve varying degrees of risk. Therefore, it should not be assumed that future performance of any specific investment or investment strategy (including the investments and/or investment strategies recommended and/or undertaken by BentOak Capital [“BentOak”]), or any non-investment related services, will be profitable, equal any historical performance level(s), be suitable for your portfolio or individual situation, or prove successful. BentOak is neither a law firm, nor a certified public accounting firm, and no portion of its services should be construed as legal or accounting advice. Moreover, you should not assume that any discussion or information contained in this document serves as the receipt of, or as a substitute for personalized investment advice from BentOak. Please remember that it remains your responsibility to advise BentOak, in writing, if there are any changes in your personal/financial situation or investment objectives for the purpose of reviewing/evaluating/revising our previous recommendations and/or services, or if you would like to impose, add, or to modify any reasonable restrictions to our investment advisory services. A copy of our current written disclosure Brochure discussing our advisory services and fees is available upon request at www.bentoakcapital.com/disclosure. The scope of the services to be provided depends upon the needs of the client and the terms of the engagement. Historical performance results for investment indices, benchmarks, and/or categories have been provided for general informational/comparison purposes only, and generally do not reflect the deduction of transaction and/or custodial charges, the deduction of an investment management fee, nor the impact of taxes, the incurrence of which would have the effect of decreasing historical performance results. It should not be assumed that your account holdings correspond directly to any comparative indices or categories. Please Also Note: (1) performance results do not reflect the impact of taxes; (2) comparative benchmarks/indices may be more or less volatile than your accounts; and, (3) a description of each comparative benchmark/index is available upon request. Please Note: Limitations: Neither rankings and/or recognitions by unaffiliated rating services, publications, media, or other organizations, nor the achievement of any designation, certification, or license should be construed by a client or prospective client as a guarantee that he/she will experience a certain level of results if BentOak is engaged, or continues to be engaged, to provide investment advisory services. Rankings published by magazines, and others, generally base their selections exclusively on information prepared and/or submitted by the recognized adviser. Rankings are generally limited to participating advisers (see link as to participation criteria/methodology, to the extent applicable). Unless expressly indicated to the contrary, BentOak did not pay a fee to be included on any such ranking. No ranking or recognition should be construed as a current or past endorsement of BentOak by any of its clients. ANY QUESTIONS: BentOak’s Chief Compliance Officer remains available to address any questions regarding rankings and/or recognitions, including the criteria used for any reflected ranking.