
The first quarter of the year presented a bumpy start to 2022. We are in a time where multiple events seem to be occurring all at once. This includes inflationary concerns, Russia’s recent aggressive actions, and the Fed raising rates to name a few. Recently there has also been news regarding the inversion of the yield curve, and what that has signaled in the past. The headlines on the yield curve are important to watch, but it is also important to put this into perspective.
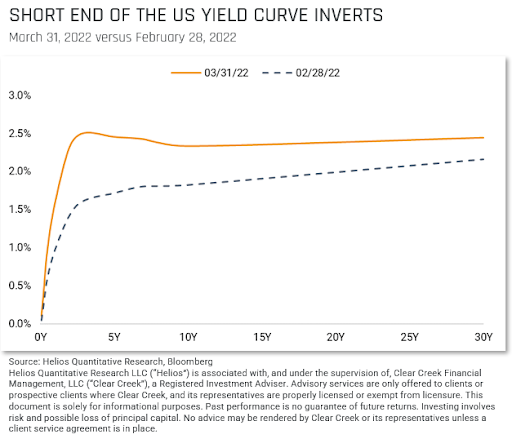
First off, the yield curve is a graph plotting what a specific type of fixed income (e.g., US Treasuries) is yielding (horizontal axis), versus their maturity (vertical axis). Typically, this graph will have an upward sloping curve, with longer term fixed income having a higher yield than shorter term fixed income. What has happened recently is a shorter part of the yield curve has risen above its longer-term counterpart. In the chart below you can see the upward sloping curve in the dotted line representing a normal curve, and then an inverted yield curve in the yellow line.
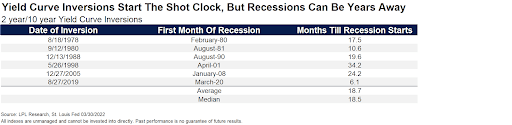
Traditionally this is seen as an indicator of future recessions but again, perspective is very important. As seen in the table below, over the past 44 years it has taken about one and a half years for a recession to start after a yield curve inversion (important to keep in mind the 2020 recession occurred due to the pandemic).
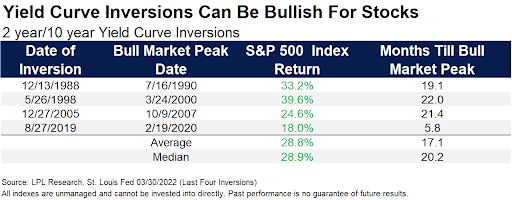
The next table reflects how the broad market (S&P 500) performed after the inversion of the 2 year and 10 year US Treasury, and also the number of months it took from the inversion date to the market’s highest point in that cycle. As you can see from the data, the market on average continues to march higher.
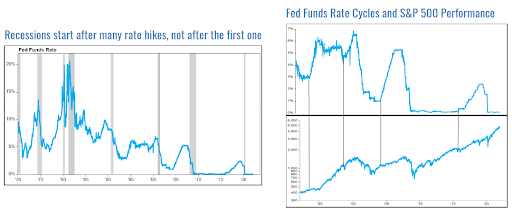
Inflation has been a consistent topic for over a year now, and rightly so as we have not seen readings at these levels since the early 1980s. The Federal Reserve recently raised short-term borrowing rates by 0.25% and is expected to increase that by another 0.5% at their next meeting. These rate hikes effect fixed income and the yield curve (pushing up the shorter end of the curve), but historically have not immediately triggered a recession. The chart below titled “Fed Funds Rate Cycles and S&P Performance” illustrates past rate hike cycles in the top chart, and the S&P 500 performance in the bottom. The vertical lines that connect the two reflect when a rate hike began and provide a graphical reference for how the S&P 500 performed thereafter. This roughly ties into the table above for how the S&P 500 performed after an inversion and shows the Fed’s activity during those periods.
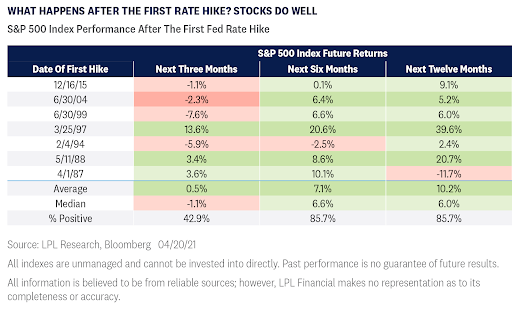
In looking at the chart titled “Recessions start after many rate hikes, not after the first one”, we could not better describe what history has shown. The grey shaded regions in this chart represent past recessions, and the blue line is the Fed Funds Rate. This reflects that we have not entered a recession when the Fed starts raising rates, but after a period of rate increases. Some pundits are speculating the implications of the Fed’s attempt to cool the economy while working to bring down inflation. Again, it is true that we have not seen inflation at these levels in some time but in looking back to the 1970s and early 1980s, we were in a higher inflationary environment then. Even during periods of higher inflation that we saw 40 to 50 years ago, there were many rate hikes before a downturn in the economy. Also, as shown in table below the market on average continues to perform well after the first rate hike in a cycle.
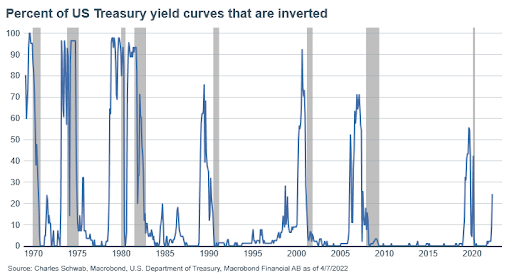
Lastly the chart below provides yet another way to view the yield curve (blue line) and past recessions (shaded grey areas). As mentioned above, only a portion of the yield curve is currently inverted. This lookback over the past 50 years reflects the percentage (vertical axis) of the yield curve that was inverted, essentially showing how much of it was at a rate higher than long-term rates. As you can see below, before most recessions a higher percentage of the yield curve was inverted (over 70% except for 2020). While the percentage of the yield curve that is inverted has ticked up recently, it is still below most of these historical levels.
In looking back at similar times in the past, history has shown us that typically this initial inversion of a portion of the yield curve does not necessarily translate to a recession. With a volatile first quarter behind us, the upcoming earnings season will be important to see how inflation has affected companies and consumers alike.
IMPORTANT DISCLOSURE INFORMATION: Past performance may not be indicative of future results. Different types of investments involve varying degrees of risk. Therefore, it should not be assumed that future performance of any specific investment or investment strategy (including the investments and/or investment strategies recommended and/or undertaken by BentOak Capital [“BentOak”]), or any non-investment related services, will be profitable, equal any historical performance level(s), be suitable for your portfolio or individual situation, or prove successful. BentOak is neither a law firm, nor a certified public accounting firm, and no portion of its services should be construed as legal or accounting advice. Moreover, you should not assume that any discussion or information contained in this document serves as the receipt of, or as a substitute for personalized investment advice from BentOak. Please remember that it remains your responsibility to advise BentOak, in writing, if there are any changes in your personal/financial situation or investment objectives for the purpose of reviewing/evaluating/revising our previous recommendations and/or services, or if you would like to impose, add, or to modify any reasonable restrictions to our investment advisory services. A copy of our current written disclosure Brochure discussing our advisory services and fees is available upon request at www.bentoakcapital.com/disclosure. The scope of the services to be provided depends upon the needs of the client and the terms of the engagement. Historical performance results for investment indices, benchmarks, and/or categories have been provided for general informational/comparison purposes only, and generally do not reflect the deduction of transaction and/or custodial charges, the deduction of an investment management fee, nor the impact of taxes, the incurrence of which would have the effect of decreasing historical performance results. It should not be assumed that your account holdings correspond directly to any comparative indices or categories. Please Also Note: (1) performance results do not reflect the impact of taxes; (2) comparative benchmarks/indices may be more or less volatile than your accounts; and, (3) a description of each comparative benchmark/index is available upon request. Please Note: Limitations: Neither rankings and/or recognitions by unaffiliated rating services, publications, media, or other organizations, nor the achievement of any designation, certification, or license should be construed by a client or prospective client as a guarantee that he/she will experience a certain level of results if BentOak is engaged, or continues to be engaged, to provide investment advisory services. Rankings published by magazines, and others, generally base their selections exclusively on information prepared and/or submitted by the recognized adviser. Rankings are generally limited to participating advisers (see link as to participation criteria/methodology, to the extent applicable). Unless expressly indicated to the contrary, BentOak did not pay a fee to be included on any such ranking. No ranking or recognition should be construed as a current or past endorsement of BentOak by any of its clients. ANY QUESTIONS: BentOak’s Chief Compliance Officer remains available to address any questions regarding rankings and/or recognitions, including the criteria used for any reflected ranking.