
The Dilemma You Face Today
If you are like many high net worth individuals right now, you have significant cash sitting on the sidelines. A recent study from the Federal Reserve shows that more than $6 trillion (with a “T”) is currently parked in money market funds, the highest level on record.
That may feel comfortable. Money markets are often paying 4%+, and cash offers the illusion of safety. Current yields are higher than the inflation rate – a near anomaly. But you know it will not last.
At the same time, stocks are trading near all-time highs. Which as an investor feels great, but putting cash to work at these levels feels risky, or at the least may give you pause. And so the dilemma continues: hold cash that can (and likely will) lose its yield overnight, or step into stocks that feel expensive.
For moderate and conservative investors, there is a third option that has not looked this compelling in decades: municipal bonds.
Why Munis Stand Out Right Now
Municipal bonds offer a three-way opportunity rarely seen in fixed income:
- Historic yields today
- Price appreciation if rates fall
- A long-term setup powered by future higher taxes, retiring demographics, normalization of rates, and infrastructure demand
What are Municipal Bonds?
Municipal bonds, or “munis,” are debt issued by states, cities, counties, and local districts to finance public projects. When you vote for a school bond, a county road expansion, or a new water system, those projects are typically funded through bonds that are packaged and sold to investors. The income generated to repay investors is backed by reliable revenue streams such as property taxes, sales taxes, and in some cases specialty fees like tolls or utility payments.
For investors, the interest paid on most municipal bonds is exempt from federal income tax. This makes them especially powerful for high-income households in taxable accounts. By contrast, they are generally not appropriate for tax-deferred accounts such as IRAs, since the tax advantage is wasted inside an already tax-sheltered vehicle.
1. Historic Yields Today and the After-Tax Advantage
Muni yields are sitting at levels last seen in the mid-2000s: 3.5–4% on average. While the nominal yields may not seem overly enticing, consider the tax benefits. For investors in higher brackets, the tax-equivalent yield (TEY) makes them even stronger:
- Tax-Equivalent Yield (TEY) = Tax-Free Yield ÷ (1−Marginal Tax Rate)
- A 4% muni yield is about 6.3% taxable equivalent in the top federal bracket (37%).
Compare that after tax:
- 5% money market → ~3.15% after tax
- 4.5% Treasury → ~2.8% after tax
- 4% muni → still 4% after tax (≈6–7% taxable equivalent)
That is the hidden edge: munis do not just match cash and Treasuries, they beat them once you account for taxes. Remember, all fixed income interest earned is taxed at your ordinary income tax rate except municipal bonds.
If you have a significant amount of taxable interest income on your 1040 Schedule B – ask yourself “why?” Because there is a better way!
2. Price Appreciation if Rates Fall
When interest rates drop, bond prices rise.
A 1% decline in yields could add 6–8% in price to an intermediate muni portfolio.
With munis, you are not just collecting income. You have room for capital gains if rates ease.
By contrast, when rates fall in money markets or short-term Treasuries, nothing happens to your principal. You simply watch your yield disappear. When yields on municipal bonds drop, the dollar amount of interest generated doesn’t change, the yield calculation just gets compressed because your principal increases. You mailbox money stays steady. With money markets, your actual income drops.
Of course, rising yields have the opposite effect and can pressure bond prices lower. But ask yourself: do you believe the Fed is more likely to raise rates from here, or lower them? Much of the damage in price action has already been absorbed during the 2022 interest rate hikes. And importantly, if you hold individual municipal bonds to maturity, your capital redeems at par.
Visualizing the Upside
The chart below from JP Morgan shows how different fixed income sectors respond to shifts in interest rates. Notice how municipals deliver steady income in flat-rate environments and meaningful appreciation if rates fall. Unlike cash equivalents, which have no price upside when rates decline, munis offer both income and potential gains.
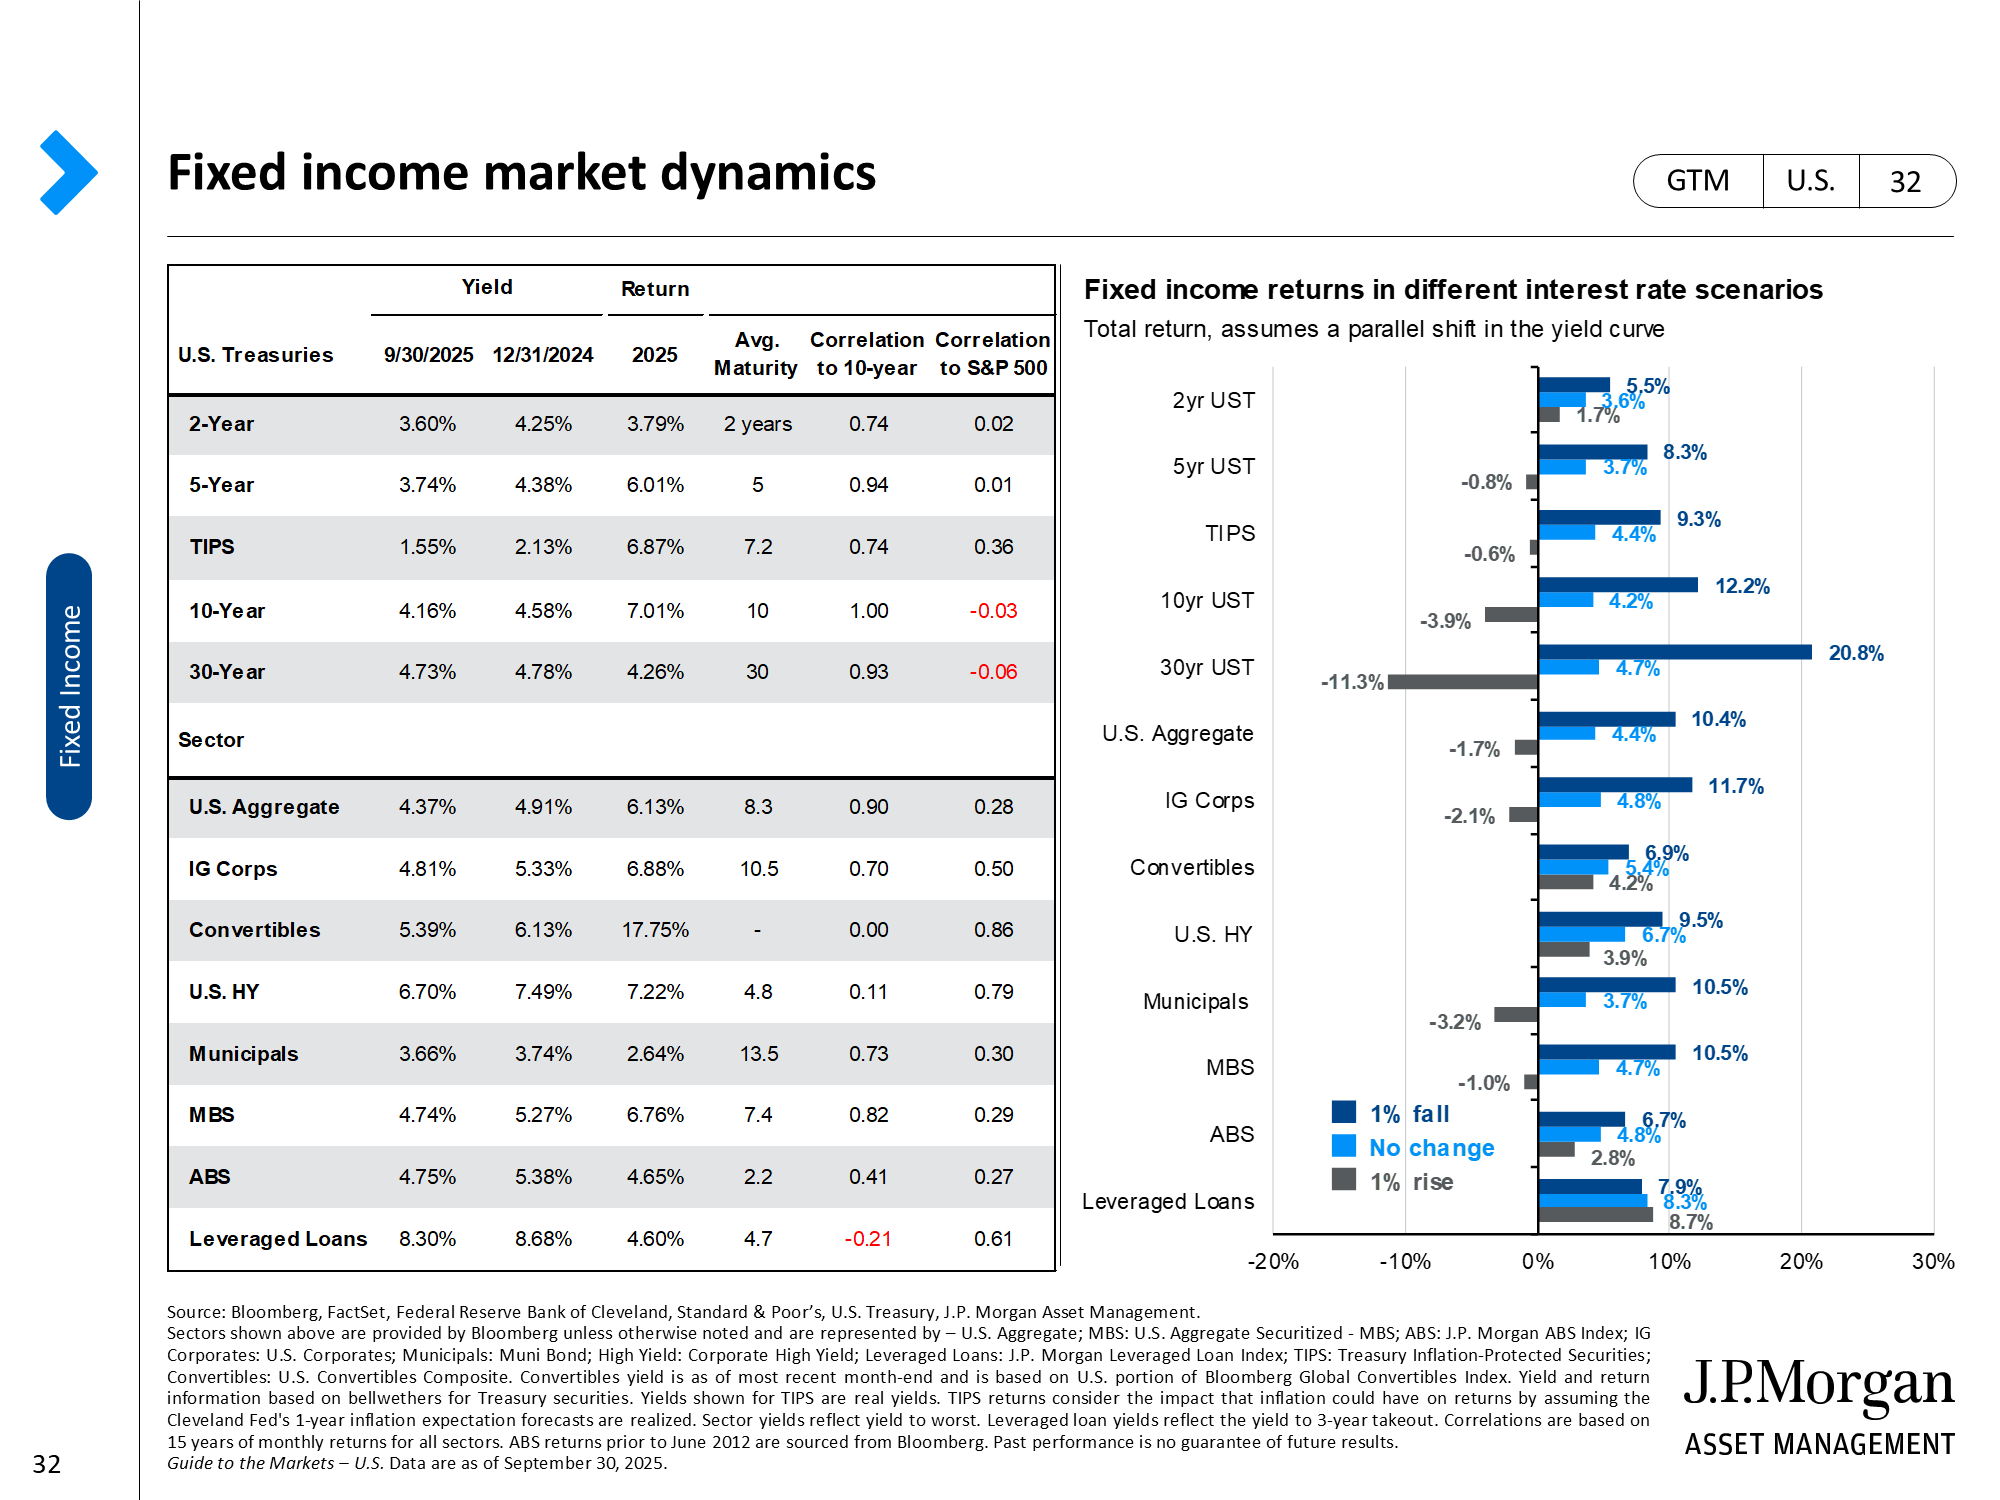
Source: JP Morgan Asset Management, as of October 22, 2025.
3. The Long-Term Setup
Beyond today’s entry point, several enduring forces reinforce the case for munis:
- Higher Taxes: With federal debt above $34 trillion, higher tax rates are a long-term reality, making tax-free income increasingly valuable.
- Demographics: Over 10,000 baby boomers retire every day. As they transition from growth to income, demand for predictable, after-tax cash flow accelerates.
- Normalization of Rates: From 2000–2020, the 10-year Treasury averaged about 3.5–4%. Locking in today’s muni yields, already at 20-year highs, sets a strong baseline before they revert closer to that modern long-term range.
- Infrastructure Demand: America’s roads, bridges, water systems, and power grids all require renewal. Trillions in capital spending will flow through municipal markets, ensuring a steady supply of bonds.
Together, these drivers make municipals not just attractive today, but a long-term structural opportunity.
The Bottom Line
Cash feels safe, but it is temporary. Yields shrink sharply after taxes and offer no upside.
Stocks offer growth, but at today’s highs, investors may be reluctant to deploy cash.
Munis provide the middle ground:
- Tax-advantaged yields not seen in 20 years
- Capital appreciation potential if rates fall
- Structural support from higher taxes, demographics, normalization of rates, and infrastructure spending
That is why munis stand apart today. They are not just another bond allocation. They are one of the most compelling opportunities in fixed income right now for taxable portfolios.
IMPORTANT DISCLOSURE INFORMATION: Past performance may not be indicative of future results. Different types of investments involve varying degrees of risk. Therefore, it should not be assumed that future performance of any specific investment or investment strategy (including the investments and/or investment strategies recommended and/or undertaken by BentOak Capital [“BentOak”]), or any non-investment related services, will be profitable, equal any historical performance level(s), be suitable for your portfolio or individual situation, or prove successful. BentOak is neither a law firm, nor a certified public accounting firm, and no portion of its services should be construed as legal or accounting advice. Moreover, you should not assume that any discussion or information contained in this document serves as the receipt of, or as a substitute for personalized investment advice from BentOak. Please remember that it remains your responsibility to advise BentOak, in writing, if there are any changes in your personal/financial situation or investment objectives for the purpose of reviewing/evaluating/revising our previous recommendations and/or services, or if you would like to impose, add, or to modify any reasonable restrictions to our investment advisory services. A copy of our current written disclosure Brochure discussing our advisory services and fees is available upon request at www.bentoakcapital.com/disclosure. The scope of the services to be provided depends upon the needs of the client and the terms of the engagement. Historical performance results for investment indices, benchmarks, and/or categories have been provided for general informational/comparison purposes only, and generally do not reflect the deduction of transaction and/or custodial charges, the deduction of an investment management fee, nor the impact of taxes, the incurrence of which would have the effect of decreasing historical performance results. It should not be assumed that your account holdings correspond directly to any comparative indices or categories. Please Also Note: (1) performance results do not reflect the impact of taxes; (2) comparative benchmarks/indices may be more or less volatile than your accounts; and, (3) a description of each comparative benchmark/index is available upon request. Please Note: Limitations: Neither rankings and/or recognitions by unaffiliated rating services, publications, media, or other organizations, nor the achievement of any designation, certification, or license should be construed by a client or prospective client as a guarantee that he/she will experience a certain level of results if BentOak is engaged, or continues to be engaged, to provide investment advisory services. Rankings published by magazines, and others, generally base their selections exclusively on information prepared and/or submitted by the recognized adviser. Rankings are generally limited to participating advisers (see link as to participation criteria/methodology, to the extent applicable). Unless expressly indicated to the contrary, BentOak did not pay a fee to be included on any such ranking. No ranking or recognition should be construed as a current or past endorsement of BentOak by any of its clients. ANY QUESTIONS: BentOak’s Chief Compliance Officer remains available to address any questions regarding rankings and/or recognitions, including the criteria used for any reflected ranking.