
The S&P 500 recently surpassed 7,500 for the first time, marking another milestone in a year that has seen many new all-time highs. This is positive for investors, especially because several sectors have contributed to this rally. These trends have also fueled enthusiasm for IPOs, particularly ones related to artificial intelligence, after years of relatively few companies going public.
This is occurring despite ongoing concerns over inflation, high oil prices, and hopes for a peace deal in Iran that has not yet materialized. In contrast to the stock market, these challenges have weighed on the bond market, pushing long-term interest rates higher. The 30-year U.S. Treasury yield, for instance, briefly reached a nearly 20-year high before settling back toward 5%. Since headlines like these can create uncertainty for markets, maintaining perspective and balance are more important than ever.
Technology stocks continue to support market performance
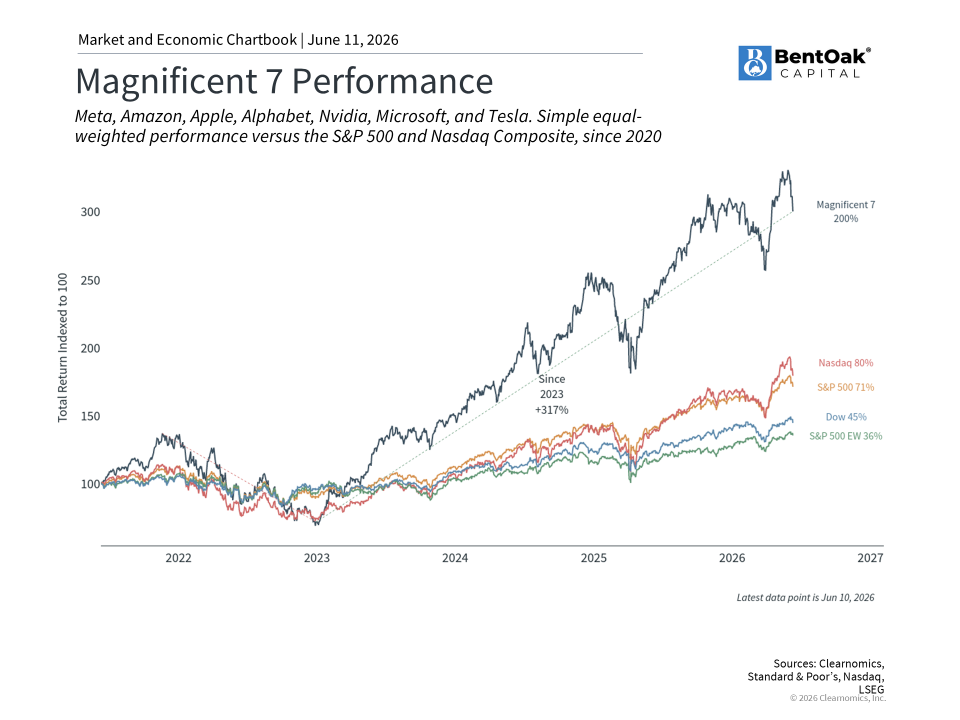
While the energy sector continues to lead the market, technology-related stocks have also contributed meaningfully to portfolio returns this year. The Magnificent 7, which includes Apple, Microsoft, Nvidia, Amazon, Alphabet, Meta, and Tesla, now represents about 35% of the S&P 500. This underscores the importance of thoughtful portfolio construction, as some investors may not fully appreciate how much exposure they carry to these individual companies today.
Strong fundamentals has been one of the primary drivers of the market this year. S&P 500 earnings growth has been running well above its historical average, and many of these large companies have continued to deliver positive earnings surprises. Current consensus earnings estimates suggest that the Information Technology and Communication Services sectors could grow earnings by 35.8% and 17.3%, respectively, over the next year.1
Other sectors, including Materials and Energy, are expected to experience above-average growth as well.
That said, valuations have climbed alongside prices. The S&P 500 forward price-to-earnings ratio currently sits near 21x, above the historical average of 16x. Technology stocks specifically trade at a forward P/E around 24x.2
While elevated valuations do not predict short-term market moves, they are an important consideration for long-term investors thinking about asset allocation. Maintaining balance across sectors, sizes, and styles can help manage risk while also allowing investors to benefit from broader market trends.
IPO activity is returning to public markets
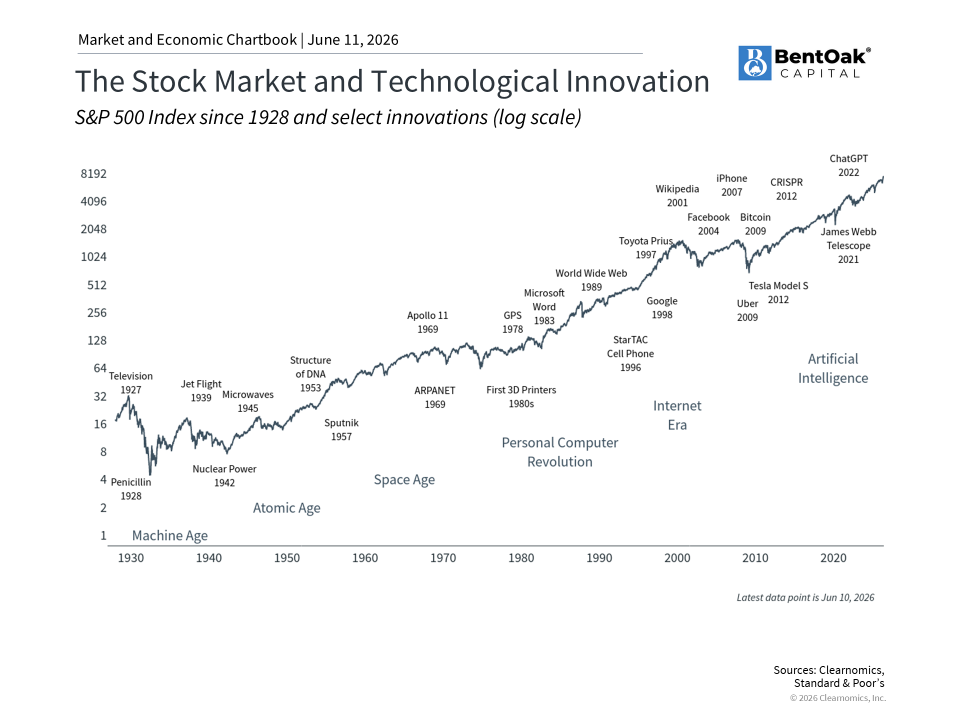
The stock market is in a constant state of evolution, as existing companies can be acquired, merged with others, or in some cases fail. At the same time, new companies can join major exchanges through a process known as an initial public offering, or IPO.
This is one reason why the investment landscape available to investors today looks quite different than it did even a decade ago. For example, while the FT Wilshire 5000 was originally designed to include roughly 5,000 publicly traded U.S. companies, today it contains only about 3,400 components.3 This reflects a long-term trend of companies choosing to remain private for longer periods. Recently, headlines have focused on a number of high-profile companies that are reportedly considering public offerings, including SpaceX, Anthropic, OpenAI, and others.4
Many of these are large businesses that have grown primarily through venture capital and private investment rather than public markets. From that perspective, these potential IPOs are a positive development, as they make shares of these companies available to a broader set of investors. Stock market indices then incorporate new public companies as they grow, meaning that long-term investors gain exposure to successful IPOs over time without needing to invest in them directly at the time of offering.
Of course, what captures the attention of many investors are the headlines and excitement surrounding IPOs. For some, it is natural to wonder whether participating in an IPO presents an opportunity for early gains. However, this is not always the case. It is often institutional investors and company insiders who truly participate in the IPO itself, and many have been invested for years before the public offering takes place. Additionally, these company insiders are often subject to lock-up periods, commonly 180 days, during which they cannot sell their shares. When these periods expire, additional selling pressure can weigh on the stock price, sometimes catching investors by surprise.
IPO activity tends to come in waves, often occurring during strong economic periods when investment capital is plentiful and market enthusiasm is high. The dot-com boom of the late 1990s is perhaps the most well-known example, but there are many others. For instance, the post-pandemic market recovery brought a surge in Special Purpose Acquisition Company (SPAC) activity, which is one way some companies can go public. This wave was relatively short-lived, demonstrating the importance of maintaining a longer-term perspective.
Long-term interest rates have remained elevated
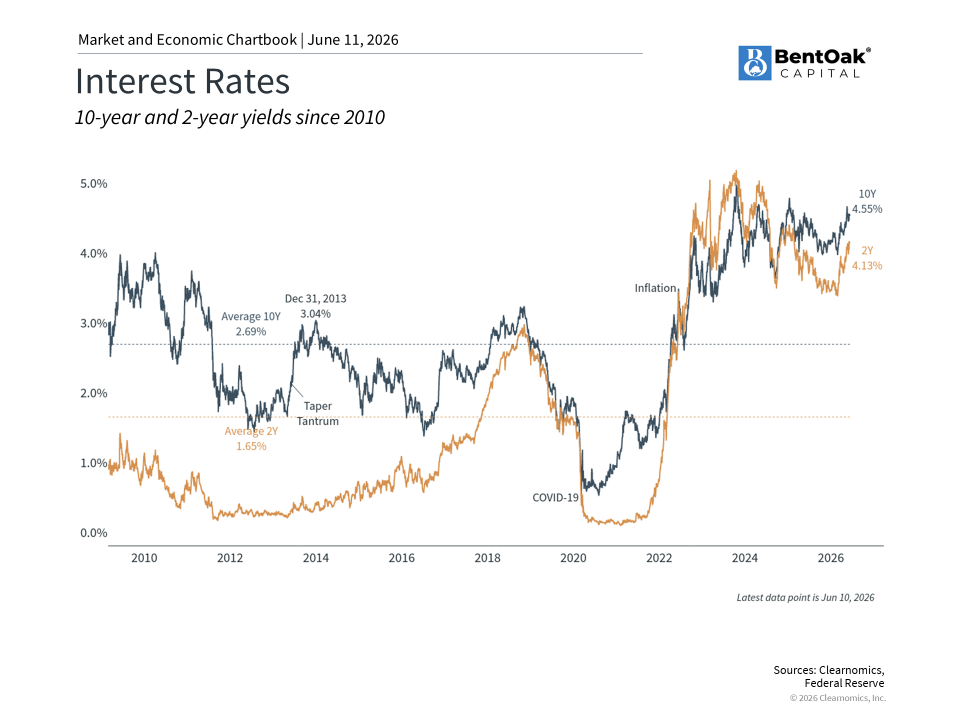
While the stock market has been climbing to new highs, long-term interest rates have also been rising. This is primarily due to inflation concerns, complicating the path of Fed policy over the next year. Technology stocks are typically sensitive to interest rates and inflation, as these factors affect the value of their future cash flows. This is one reason these stocks struggled in 2022 as interest rates spiked, and then performed well as inflation moderated in the years since.
Beyond the technology sector, higher interest rates have broad implications across the economy and markets. Mortgage rates have moved up, with the 30-year fixed rate now around 6.5%, above the long-term average of 6.02% since 1990. This affects housing affordability and broader real estate activity. Higher rates also influence the cost of capital for businesses and the discount rate applied to future earnings, which can affect stock valuations, particularly for growth-oriented companies whose value depends heavily on future cash flows.
At the same time, higher interest rates mean that bonds are now offering more meaningful income than they have in many years. Investment grade corporate bonds yield ~5.3%, compared to a long-term average of ~3.8%. Treasurys yield ~4.4%, well above their historical average of ~2.2%.5 For investors, this creates more attractive opportunities in fixed income, which can play a more meaningful role in diversified portfolios going forward.
While the stock market has reached new milestones this year, elevated interest rates and a backdrop of heightened volatility leading up to mid-term elections, ongoing geopolitical uncertainty, and the transition to a new Fed chair serve as reminders that the broader economic environment may present near term headwinds. Even so, corporate fundamentals remain broadly resilient, with many companies maintaining strong balance sheets and earnings power, and the potential for progress on geopolitical tensions could help improve sentiment over time.
References
1. Clearnomics research and LSEG data as of May 20, 2026
2. https://bentoakcapital.com/p-e-ratios-are-elevated-but-is-that-a-signal-or-a-shift/
3. https://cdn.prod.website-files.com/63e3e50fdce0bcaff7861530/6965694be133b820fb1f390d_FT%20Wilshire%205000%20Index%20Series%20Factsheet%20v2%20-%20Dec%202025.pdf
4. https://www.wsj.com/topics/subject/initial-public-offerings-ipos
5. Bloomberg U.S. Corporate Investment Grade and Bloomberg U.S. Treasury Index yields, as of May 22, 2026
Index Descriptions
S&P 500
The Standard & Poor’s 500 Index is a capitalization-weighted index of 500 stocks designed to measure performance of the broad domestic economy through changes in the aggregate market value of 500 stocks representing all major industries.
The modern design of the S&P 500 stock index was first launched in 1957. Performance prior to 1957 incorporates the performance of the predecessor index, the S&P 90.
NASDAQ
The NASDAQ Composite Index measures all NASDAQ domestic and non-U.S. based common stocks listed on The NASDAQ Stock Market. The market value, the last sale price multiplied by total shares outstanding, is calculated throughout the trading day, and is related to the total value of the Index.
BentOak is neither a law firm, nor a certified public accounting firm, and no portion of its services should be construed as legal or accounting advice. Moreover, you should not assume that any discussion or information contained in this document serves as the receipt of, or as a substitute for, personalized investment advice from BentOak. Please remember that it remains your responsibility to advise BentOak, in writing, if there are any changes in your personal/financial situation or investment objectives for the purpose of reviewing/evaluating/revising our previous recommendations and/or services, or if you would like to impose, add, or to modify any reasonable restrictions to our investment advisory services.
A copy of our current written disclosure Brochure discussing our advisory services and fees is available upon request at www.bentoakcapital.com/contact-us. The scope of the services to be provided depends upon the needs of the client and the terms of the engagement.
This material is for general information only and is not intended to provide specific advice or recommendations for any individual. There is no assurance that the views or strategies discussed are suitable for all investors or will yield positive outcomes. Investing involves risks including possible loss of principal. No investment strategy or risk management technique can guarantee return or eliminate risk in all market environments Any economic forecasts set forth may not develop as predicted and are subject to change.
References to markets, asset classes, and sectors are generally regarding the corresponding market index. Indexes are unmanaged statistical composites and cannot be invested into directly. Index performance is not indicative of the performance of any investment and do not reflect fees, expenses, or sales charges. All performance referenced is historical and is no guarantee of future results.
This information is not intended to be a substitute for specific individualized tax or legal advice. We suggest that you discuss your specific situation with a qualified tax or legal professional.
Bonds are subject to market and interest rate risk if sold prior to maturity. Bond values will decline as interest rates rise and bonds are subject to availability and change in price.
U.S. Treasury securities are guaranteed by the federal government as to the timely payment of principal and interest. The principal value of Treasury securities and other bonds fluctuates with market conditions.
International investments carry additional risks, which include differences in financial reporting standards, currency exchange rates, political risks unique to a specific country, foreign taxes and regulations, and the potential for illiquid markets. These factors may result in greater share price volatility.
This material was prepared by Clearnomics, Inc., who is not affiliated with the named financial professional, firm or broker/dealer.
Copyright (c) 2026 Clearnomics, Inc. All rights reserved. The information contained herein has been obtained from sources believed to be reliable, but is not necessarily complete and its accuracy cannot be guaranteed. No representation or warranty, express or implied, is made as to the fairness, accuracy, completeness, or correctness of the information and opinions contained herein. The views and the other information provided are subject to change without notice. All reports posted on or via www.clearnomics.com or any affiliated websites, applications, or services are issued without regard to the specific investment objectives, financial situation, or particular needs of any specific recipient and are not to be construed as a solicitation or an offer to buy or sell any securities or related financial instruments. Past performance is not necessarily a guide to future results. Company fundamentals and earnings may be mentioned occasionally, but should not be construed as a recommendation to buy, sell, or hold the company’s stock. Predictions, forecasts, and estimates for any and all markets should not be construed as recommendations to buy, sell, or hold any security–including mutual funds, futures contracts, and exchange traded funds, or any similar instruments. The text, images, and other materials contained or displayed in this report are proprietary to Clearnomics, Inc. and constitute valuable intellectual property. All unauthorized reproduction or other use of material from Clearnomics, Inc. shall be deemed willful infringement(s) of this copyright and other proprietary and intellectual property rights, including but not limited to, rights of privacy. Clearnomics, Inc. expressly reserves all rights in connection with its intellectual property, including without limitation the right to block the transfer of its products and services and/or to track usage thereof, through electronic tracking technology, and all other lawful means, now known or hereafter devised. Clearnomics, Inc. reserves the right, without further notice, to pursue to the fullest extent allowed by the law any and all criminal and civil remedies for the violation of its rights.
IMPORTANT DISCLOSURE INFORMATION: Past performance may not be indicative of future results. Different types of investments involve varying degrees of risk. Therefore, it should not be assumed that future performance of any specific investment or investment strategy (including the investments and/or investment strategies recommended and/or undertaken by BentOak Capital [“BentOak”]), or any non-investment related services, will be profitable, equal any historical performance level(s), be suitable for your portfolio or individual situation, or prove successful. BentOak is neither a law firm, nor a certified public accounting firm, and no portion of its services should be construed as legal or accounting advice. Moreover, you should not assume that any discussion or information contained in this document serves as the receipt of, or as a substitute for personalized investment advice from BentOak. Please remember that it remains your responsibility to advise BentOak, in writing, if there are any changes in your personal/financial situation or investment objectives for the purpose of reviewing/evaluating/revising our previous recommendations and/or services, or if you would like to impose, add, or to modify any reasonable restrictions to our investment advisory services. A copy of our current written disclosure Brochure discussing our advisory services and fees is available upon request at www.bentoakcapital.com/disclosure. The scope of the services to be provided depends upon the needs of the client and the terms of the engagement. Historical performance results for investment indices, benchmarks, and/or categories have been provided for general informational/comparison purposes only, and generally do not reflect the deduction of transaction and/or custodial charges, the deduction of an investment management fee, nor the impact of taxes, the incurrence of which would have the effect of decreasing historical performance results. It should not be assumed that your account holdings correspond directly to any comparative indices or categories. Please Also Note: (1) performance results do not reflect the impact of taxes; (2) comparative benchmarks/indices may be more or less volatile than your accounts; and, (3) a description of each comparative benchmark/index is available upon request. Please Note: Limitations: Neither rankings and/or recognitions by unaffiliated rating services, publications, media, or other organizations, nor the achievement of any designation, certification, or license should be construed by a client or prospective client as a guarantee that he/she will experience a certain level of results if BentOak is engaged, or continues to be engaged, to provide investment advisory services. Rankings published by magazines, and others, generally base their selections exclusively on information prepared and/or submitted by the recognized adviser. Rankings are generally limited to participating advisers (see link as to participation criteria/methodology, to the extent applicable). Unless expressly indicated to the contrary, BentOak did not pay a fee to be included on any such ranking. No ranking or recognition should be construed as a current or past endorsement of BentOak by any of its clients. ANY QUESTIONS: BentOak’s Chief Compliance Officer remains available to address any questions regarding rankings and/or recognitions, including the criteria used for any reflected ranking.